Billing Manager
Data Visualisation for streamlining brokerage management functionsDescription
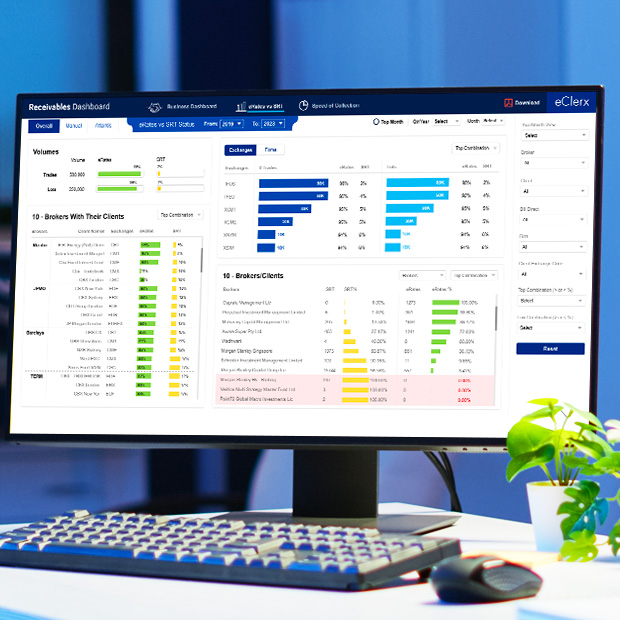
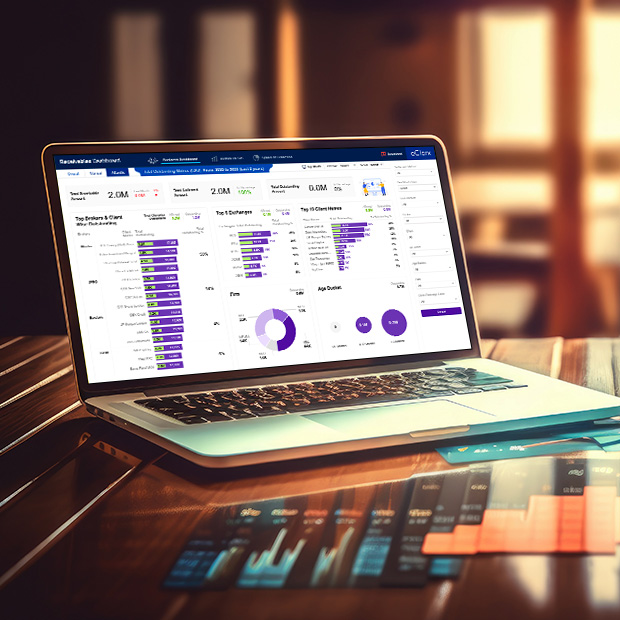
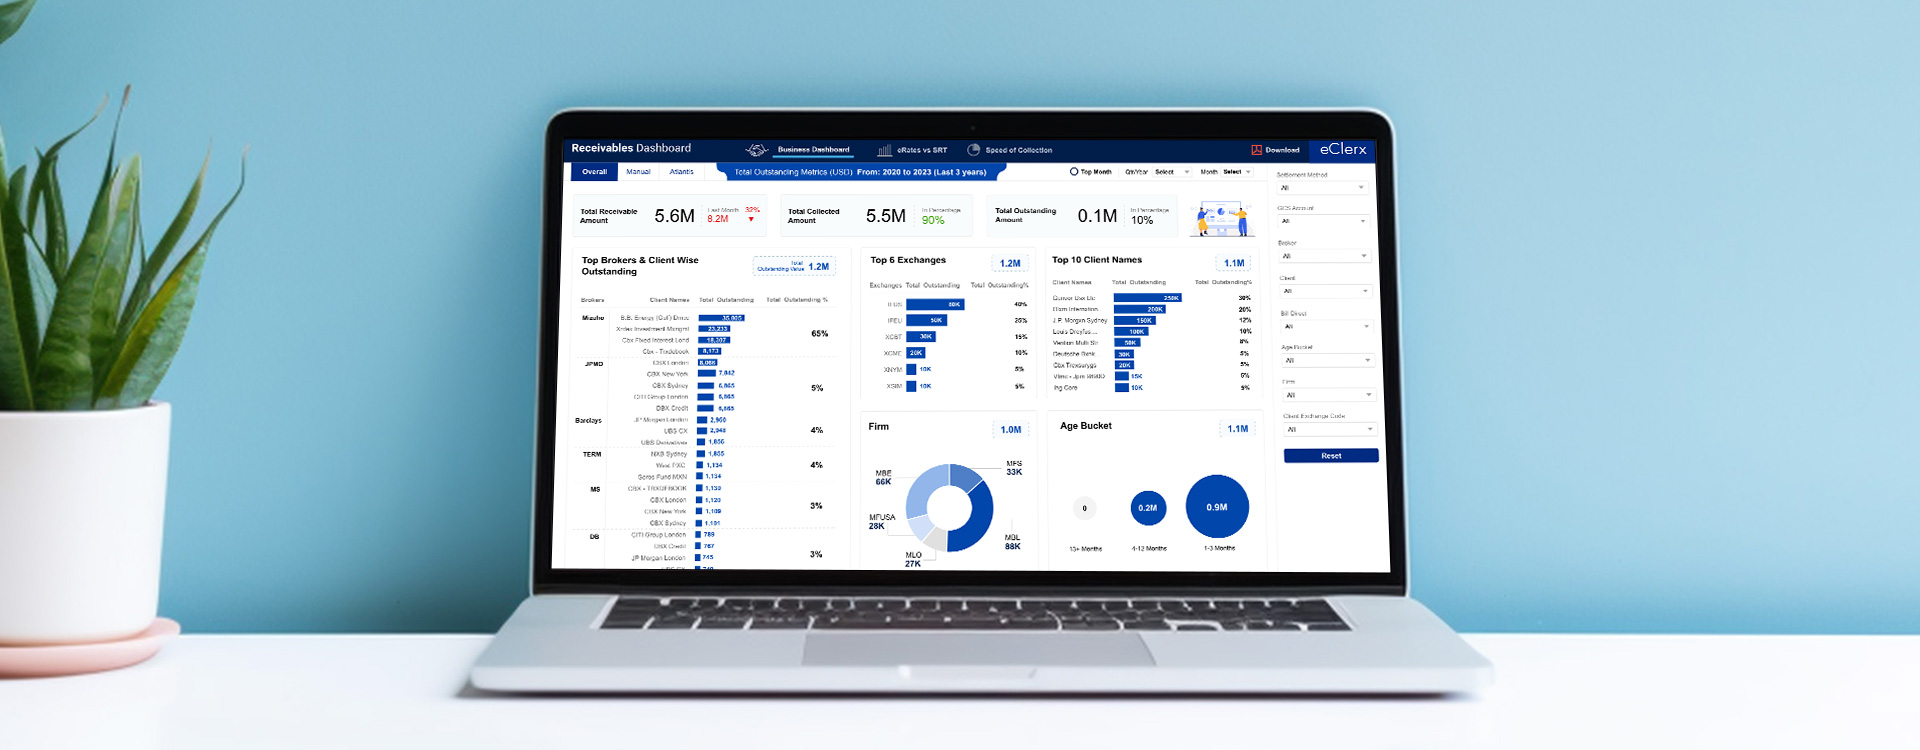
End to end design and development lifecycle executed for a dashboard to streamline and standardize brokerage management functions. The client expressed a need for more insightful metrics and visually appealing and engaging data visualization using Power BI.
Services
Information Architecture
Data Visualisation
User Research
Client
US Financial Major
Project details
Existing dashboards were static in nature, with very little interactivity and the
metrics were not providing enough feasible insights.
The data visualizations used were not visually appealing. Design navigations were not smooth and
lacked a well-researched UI layer.
Approach Identification
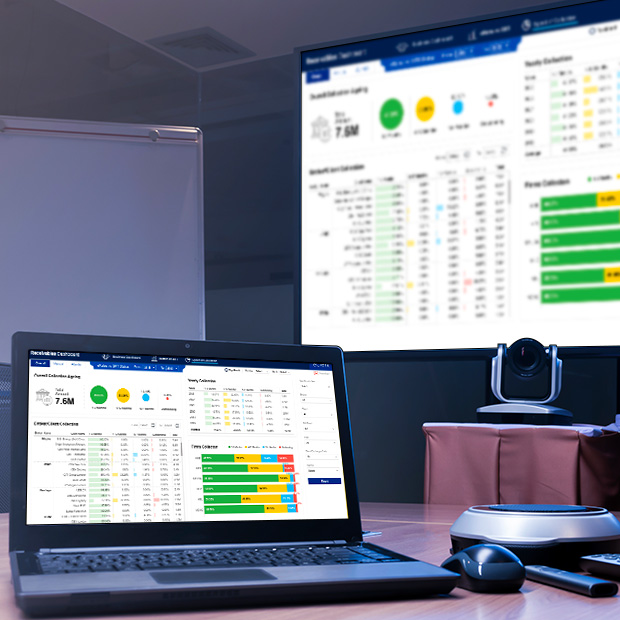
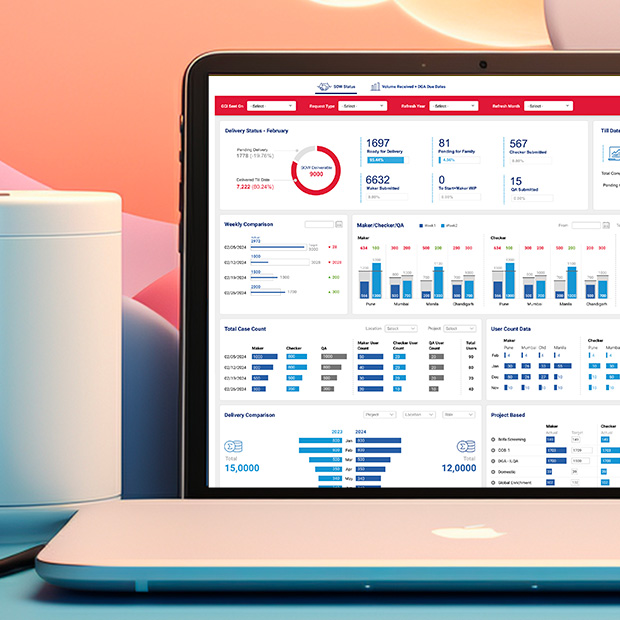
The new solution using Power BI has user centric design and is descriptive enough for a variety of users featuring easy navigation. It is now designed to cater multiple data views as per business needs on the fly. Power BI Advanced Analytics Integration implemented for greater analytics capabilities and meaningful data.
The Solution
New dynamic and user friendly dashboard offering over earlier traditional web based solutions. This helps in decision making in real-time, with more flexibility. Fragmented views of specific data subsets have been built in to cater to specific needs of a diverse audience.