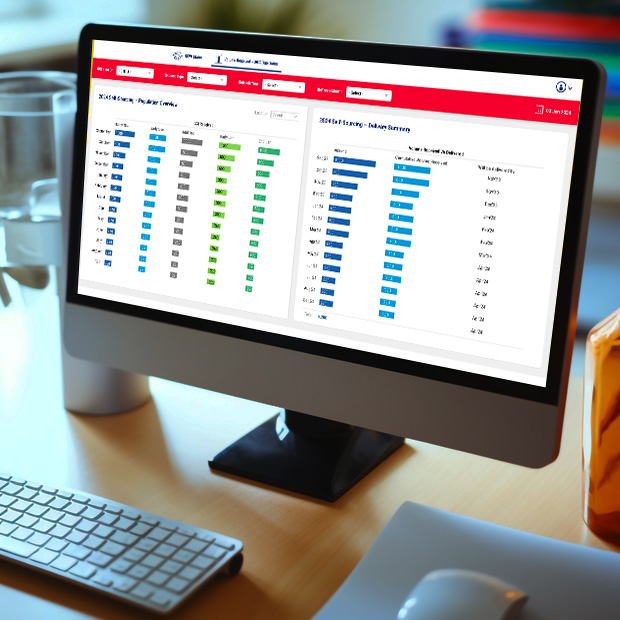
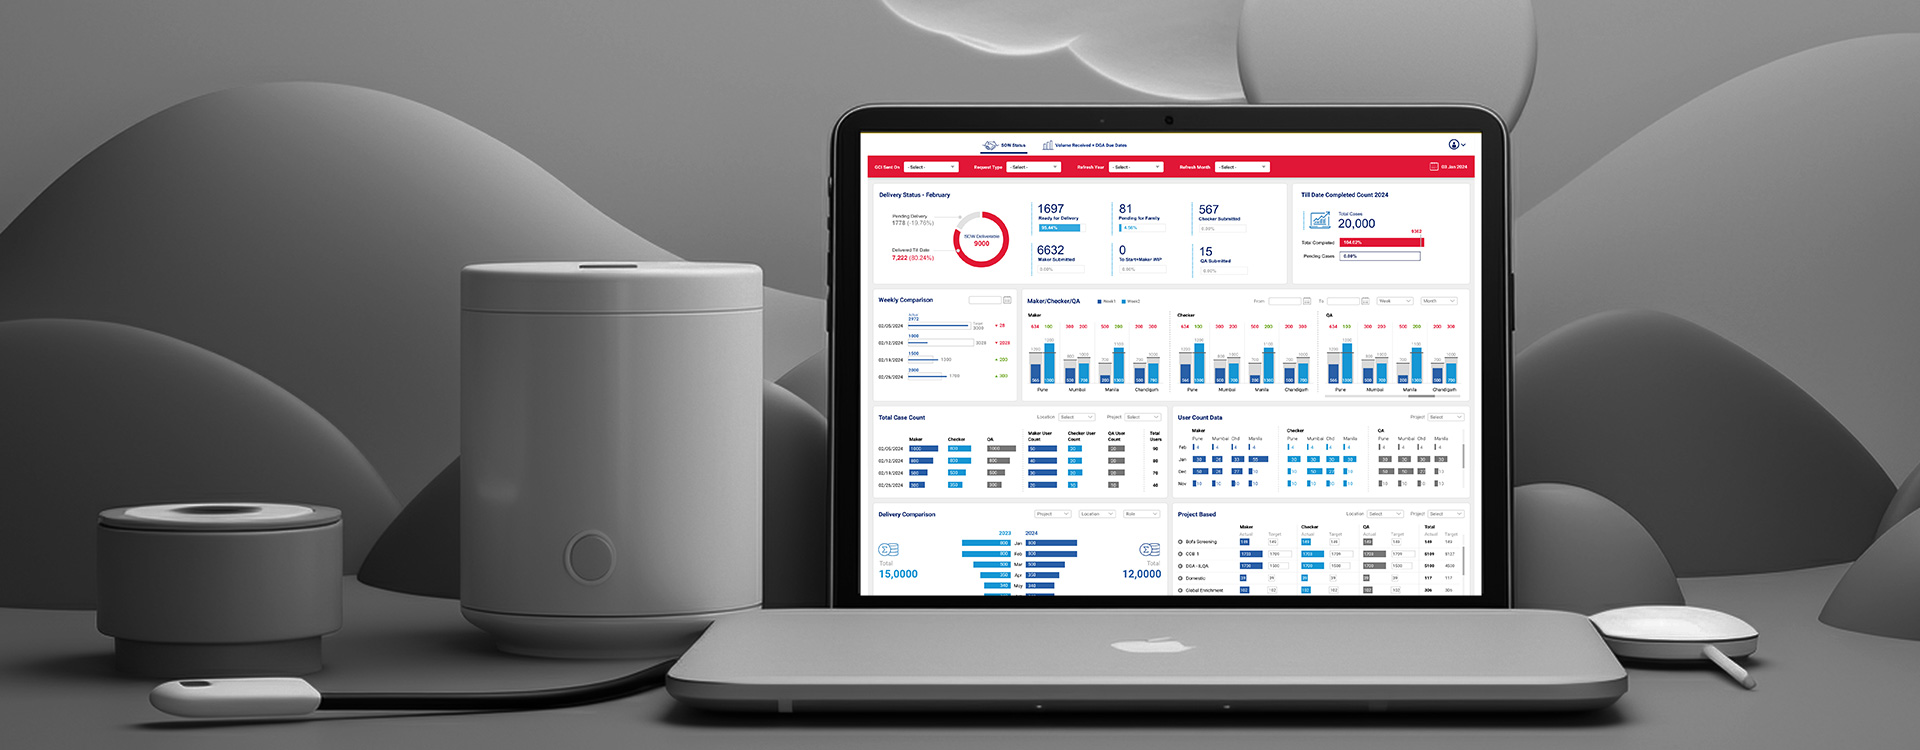
Delivery Status Dashboard
Multiple KPI reporting and status tracking for senior managementDescription
A Financial Services client wanted to report multiple KPIs for Delivery Status and related details of every month on a single dashboard for senior management. This reporting was being done using spreadsheets which proved difficult to distribute and consume.
Services
User Research
Information Architecture
Data Visualisation
Client
A Major US Bank
Project details
We managed the entire lifecycle in a short amount of time by quickly and easily
visualizing data using Tableau.
We gave the client the ability to identify patterns and trends in data in a way that was
previously not possible using spreadsheets.
Our main objective was to allow users to be able to make data-driven decisions as well as share
and collaborate on data and insights with others
Approach Identification
The dashboard was designed from scratch by first analyzing and defining user journeys and defining the objective for the dashboard. Development was done in collaboration with the ops and data teams using Tableau. Various distributed data sources were integrated into the data model. Interactive and dynamic visualizations were created.
The Solution
The final product helps users see the value of the dashboard as more than a sophisticated tool, but as an indispensable asset that has the power to address each stakeholder’s main concerns.