Global Command Centre
Large Scale Dashboard System DesignDescription
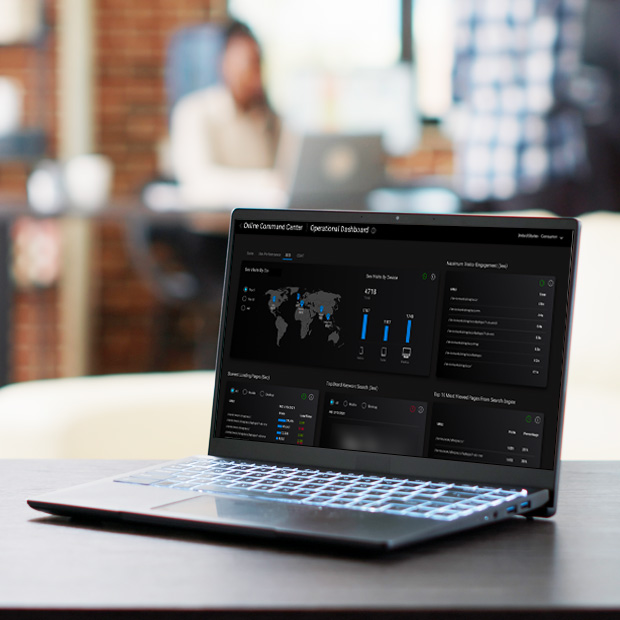
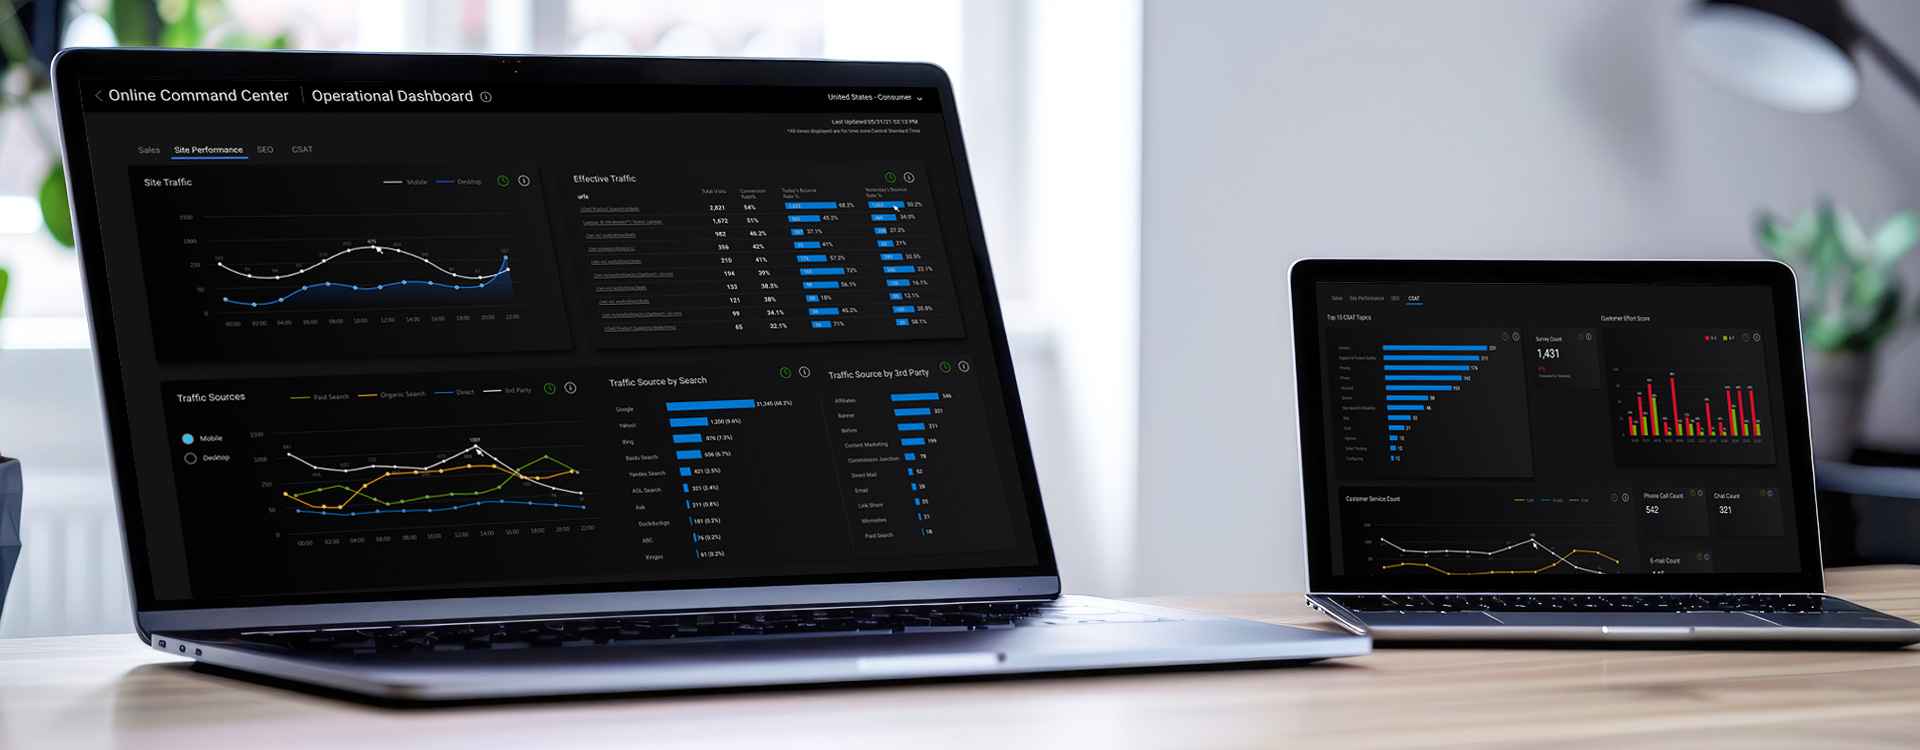
Mega-corporations demand global command center dashboards that are the nerve centers of their real-time data. They need instant insights, pinpointing issues and optimizing performance across vast, complex systems. ensuring readily accessible critical information to authorised personnel.
Services
User Research
Experience & Usability
Website Design
Data visualisation
Client
American Multinational Computer Technology Company
Project details
While there are a lot of new features that are being introduced every day, the
way data is presented has, more or less, remained the same.
The scope of functionality and usability is being dictated by the way data is presented, and
hence, function has become limited by form.
The global IT peripheral leader required a
dashboard system that spread over geographies, jurisdictions , cultures and norms, that needed
to be designed
so that all the real time data could be easily accessed, digested, analysed and converted into
insights, from anywhere.
Approach Identification
Our team of multidisciplinary experts marry data visualisation tools, principles of Cognitive neuroscience and Usability design, to create dashboards that provide easy access, upfront insights, priority and frequency based architecture and interactability to create personalised views. The Design had to consider very long hour exposure to data heavy interfaces, with the possibility of very low saturation thresholds for the operatives.
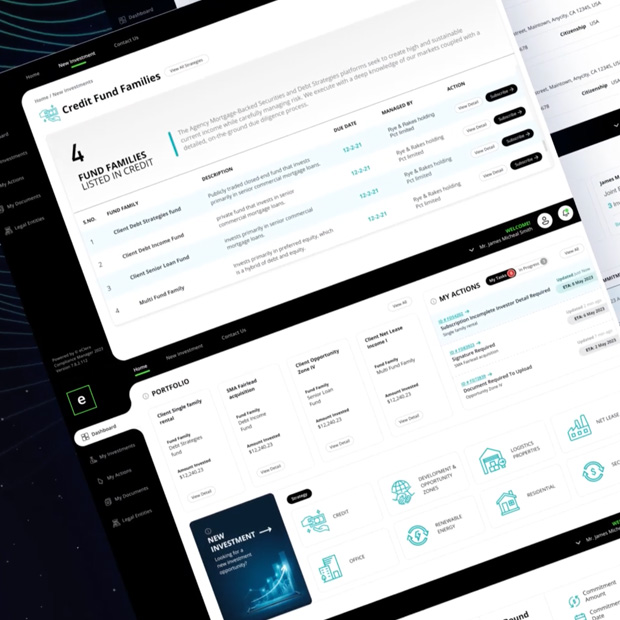
The Solution
Using attributes of Pre-Attentive processing, Usability design and Principles of User experience, keeping in mind the issue of cognitve overloading around number intensive interfaces, we created a UI that was geography, conventions and norms neutral, while providing a very high level of contrast to the visual elements for easier viewing and scanning. Direct interviews with the main user as well as global and regional stakeholders helped us create priority structures and user journeys for quicker access to relevant data and a “field-of-view” analysis for rapid in-sighting, dramatically improving upon efficacy, ease of use and human error.